Cumulative Proximity Breach Maps
Cumulative Proximity Breach Maps indicate how long mapped areas are above the desired social distancing density, giving a quantitative measure whereby users can qualify their scenario changes
Social distancing density uses a circular density calculation based on social distance radius (SD):
Density = 1 /πx SD2 which gives:
Cumulative Proximity Breach Maps are added by default to new and existing LEGION Simulator projects.
The Map accumulates each time entity density goes above the density relating to a given social distance. Bluer areas a low risk, yellow-orange areas are riskier, red-pink areas are highest risk. These Maps use the Extended Spectral Progression Value Range, where pink represents 15 minutes or higher. An example is shown below:
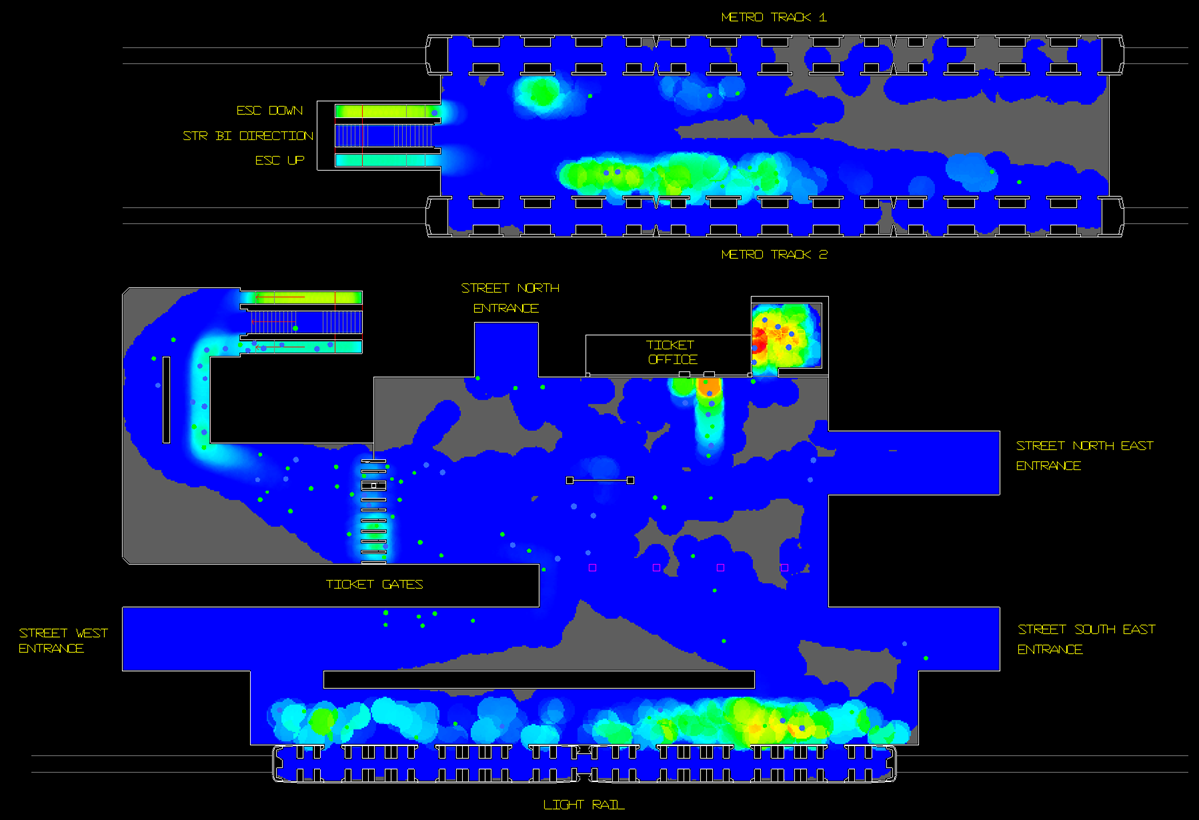
Areas becoming green/yellow/red/pink indicate progressively higher risk.
Maps are found in the Analysis tab of the Object Directory.
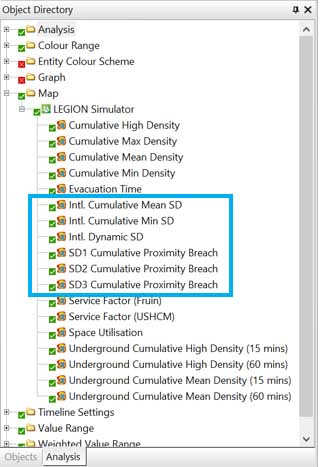
The three Intl. Maps evaluate entity density with distance-based density thresholds listed at the top of this topic (i.e., 1m, 1.5, 1.83m {6 feet} and 2m), which cover four of the most commonly used social distances around the world.
The SD1, SD2, and SD3 Cumulative Proximity Breach Maps use distances assigned to their equivalent Social Distancing metrics SD1, SD2 and SD3. As such, these distances are variable and project specific.